Brighton & Hove: Asking Price vs Sold Price in 2026
Published 18 October 2026 · Offer Smart Insights
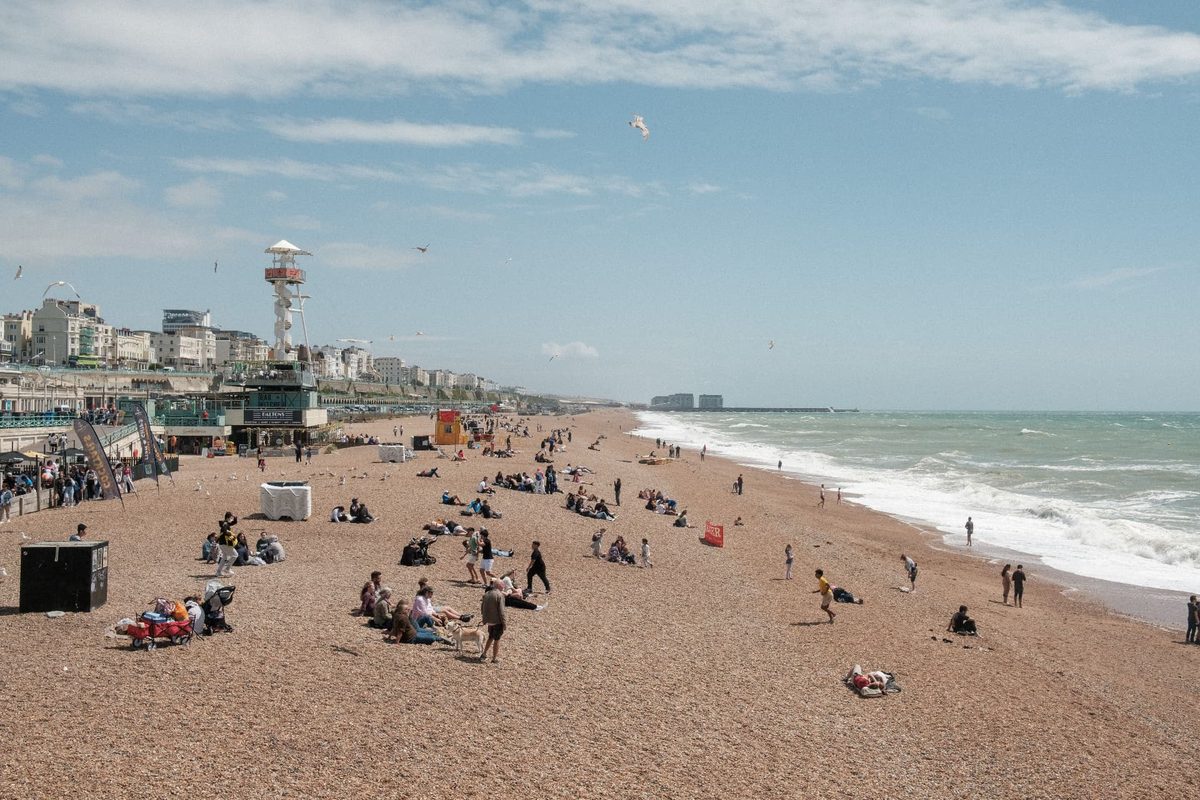
Brighton has the biggest gap of any city we've looked at so far. The average home listed in Brighton & Hove is priced at £505,756, while the official Land Registry average sold price is £403,449 (March 2026), down 3.4% on the year before.
Average asking price
£505,756
Average sold price (Land Registry)
£403,449
Headline gap
~£102,000 (20%)
Average asking price reduction
2.8%
Time to go under offer
~14 weeks
The story
That doesn't mean you can knock £100k off the asking price. Asking-price averages are pulled up by larger homes and by properties that sit on the market unsold, and Land Registry data runs one to two months behind. The more useful number for buyers is how much sellers actually drop. In Brighton & Hove, asking prices are reduced by 2.8% on average. On a typical £505k listing that's around £14,000.
What this means if you're buying in Brighton & Hove
- Prices fell over the last year, so sellers who priced at last year's levels are often the ones cutting.
- Homes take around 14 weeks to go under offer. A listing that has been up longer than that has more room to negotiate.
- BN1 is a useful benchmark: the median sold price across 68 recent sales was £450,000.
How to use this when you make an offer
Don't anchor on the asking price. Check what similar homes on the same street actually sold for, how long this one has been listed, and whether it's already been reduced. That's what an Offer Smart report pulls together for you.
Where this data comes from
Asking prices and reductions from GetAgent market data (October 2026). Sold prices from HM Land Registry UK House Price Index and Price Paid Data. Contains HM Land Registry data © Crown copyright and database right 2026.
Other cities
Check a property before you offer
See how a specific home's asking price compares with recent sales nearby.
Get a full report – £19.99